
Named client
US Open (tennis) · PMY Group
Measured every US Open since 2021
- 220,621 unique devices at the 2025 edition
- 36% engaged · 39% returning · 28 min average engaged dwell
- Recurring since 2021 · delivered via PMY Group
More than 1,400 events supported directly
Which zones held your visitors, which were walked past, and what to change before the next event — answered zone by zone, day by day, from passive WiFi sensors that anonymise everything on the sensor itself. At Palfinger’s two-floor Las Vegas booth: 33,464 unique devices measured across five days.
How it works
AP-class, listen-only hardware on existing structures — a 220V outlet is the whole requirement. Each sensor hears phones within ~10 m; three or more seeing the same device gives approximate location.
The sensor hashes each device identifier with a random salt in 1–3 seconds. Raw identifiers are never stored — on the sensor, in transit, or on the server. The salt is destroyed when your event closes.
Zone visits resolve into faraway, passer-by and engaged (≥ 30 s dwell, stated). Daily cleaning removes staff and fixtures; then the final daily report publishes. Counts are unique devices, not people.
What you receive
A production dashboard view. Each line is a path visitors actually took between zones; thickness is how many took it.
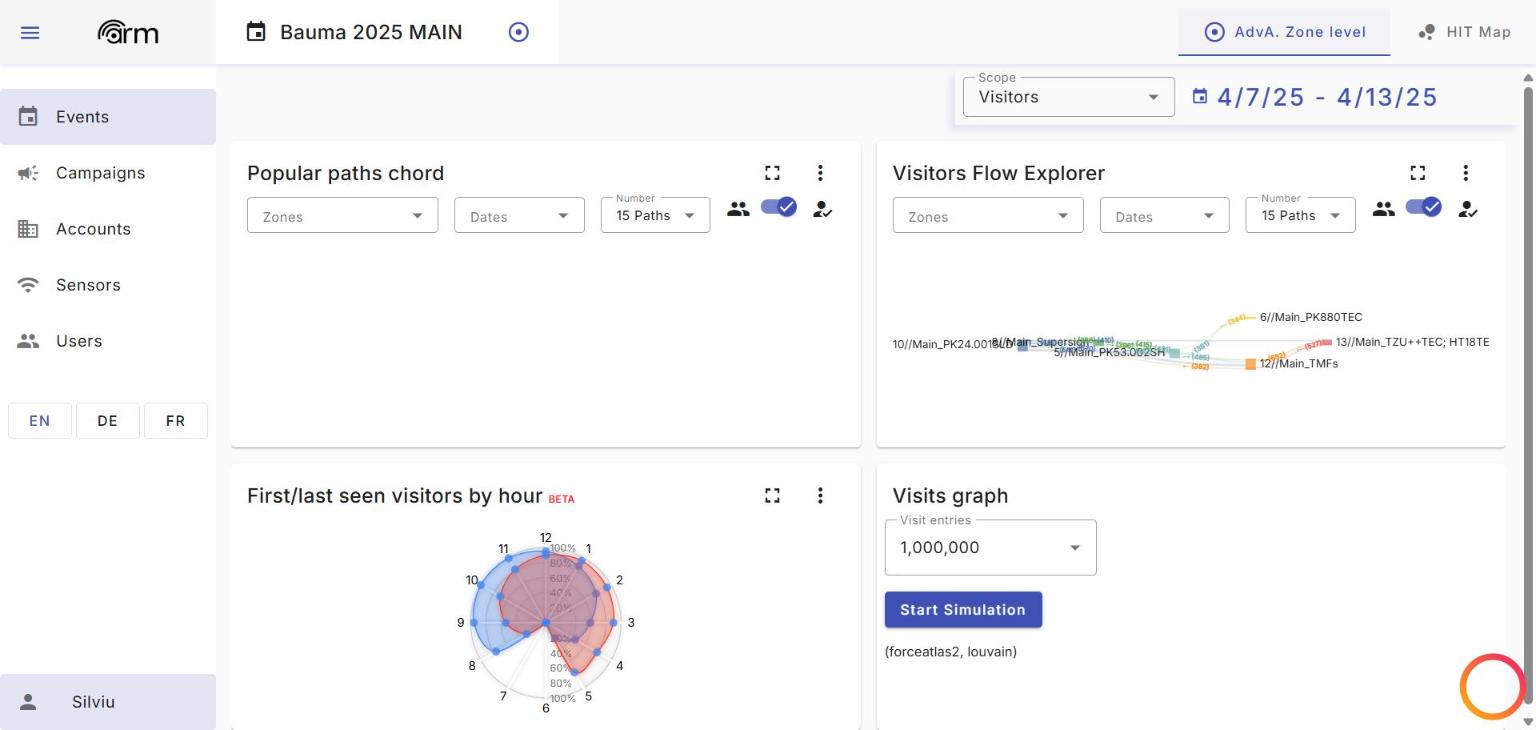
In production
Named where clients have agreed; anonymised proofs where they haven’t. Every figure below was read from the production dashboard.
Named client
Measured every US Open since 2021
Named client
One campaign, two activations, one comparable read
Anonymised
Race-weekend crowd measurement at circuit scale
Products
Reports
The same sensor layer answers the exhibitor’s question, the organiser’s question and the venue’s question — as separate reports, each sold to the team that needs it. Three samples are public.
Partners
Partners and agencies deliver 100% of our transient-event work. The dashboard whitelabels, and EYEframe embeds reports in your own portal in about a day and a half of integration — agency partners include PMY Group and Mirrored Media.
Start small
The recommended path: a 1–2 month fixed-cost baseline deployment, then expand to the areas the data says matter. You hold the hardware and activate it when you measure.
4G/LTE data traffic included. Standard list, individually negotiated. Permanent installations are priced per site.
A worked example
A 10-sensor booth at a 4-day trade show: hardware 10 × €250 = €2,500 one-time — the sensors are yours to keep — plus activation 10 × 4 × €80 = €3,200. First deployment about €5,700; the next event on the same kit, about €3,200. In months you don’t measure, you pay nothing; in active months the €350 minimum applies. 4G included; standard list, individually negotiated.
Straight answers
No, and we will not pretend otherwise. Counts are unique devices, not people. Phones with WiFi switched off are not seen; some visitors carry two devices; modern phones randomise their identifiers, which our statistical model accounts for. We do not apply a hidden multiplier to turn devices into “visitors” — you get the device numbers and the definitions, and the comparison that matters is like-for-like across your own zones, days and editions.
The passive pipeline is built so that we do not. Each device is assigned a pseudonymous identity, irreversibly de-linked at campaign end: the salt that links a device to its hash is destroyed when your event closes (or at campaign end by agreement), and destruction irreversibly eliminates linkability in production systems. No report cell ever represents fewer than 12 devices — in production since 2019 — and outputs are aggregate statistics only: no profiles are created, stored, or delivered, and no re-marketing use.
We publish one calibration point rather than a blanket percentage: at a major international Grand Prix, our weekend figure of 289,661 unique devices compared with a box office of 301,837 tickets — within about 4%, with the caveats stated in full in our case studies (devices are not people; tickets include no-shows; agreement is venue-dependent). Any accuracy figure without its method and bounds is marketing, not measurement.
Yes, as standard. The anonymised, consolidated data behind your reports is exportable — it is your deployment. Anonymous aggregates and delivered reports are retained for 12 months.
Scope a deployment
We reply with a scoped proposal: zones, sensor count, and the reports you’d get. Or write to info@advancedradiomapping.com.