
Reports
One deployment. Answers for every team.
The same sensor layer answers different people’s questions. Exhibitors want to know what the stand did; organisers want the event total; marketing wants segments; venues want the monthly heartbeat. Each is its own report, sold to the team that needs it.
Why exhibitors buy
The measurement gap is real.
Industry research by Explori with UFI has found that for the large majority of exhibiting companies, measurement of trade-show performance has barely advanced in decades — budgets are defended with badge scans and gut feel. An A-series report replaces that with the funnel: who came near, who passed by, who engaged, and for how long.
A
Event performance
What did this event or stand actually do: uniques, funnel, dwell, zone gravity centres, the conversion gap — for exhibitors and organisers.
B
Behavioural segmentation
Who your visitors were, behaviourally: movement communities turned into personas with per-segment marketing playbooks — for marketing departments.
C
Campaign & cross-event
Many activations, one read: anchor-vs-satellite crossover, roadshow legs compared on identical definitions — for brands and agencies.
D
Venue heartbeat
The monthly rhythm of a permanent site: attendance, dwell, zone performance, month-over-month — for venues, museums and destinations.
Public samples
Three samples, downloadable now.
Built on anonymised sample data, in the exact format a client receives. Every report carries its definitions and limitations on the page — counts are unique devices, not people, and no report cell ever represents fewer than 12 devices.
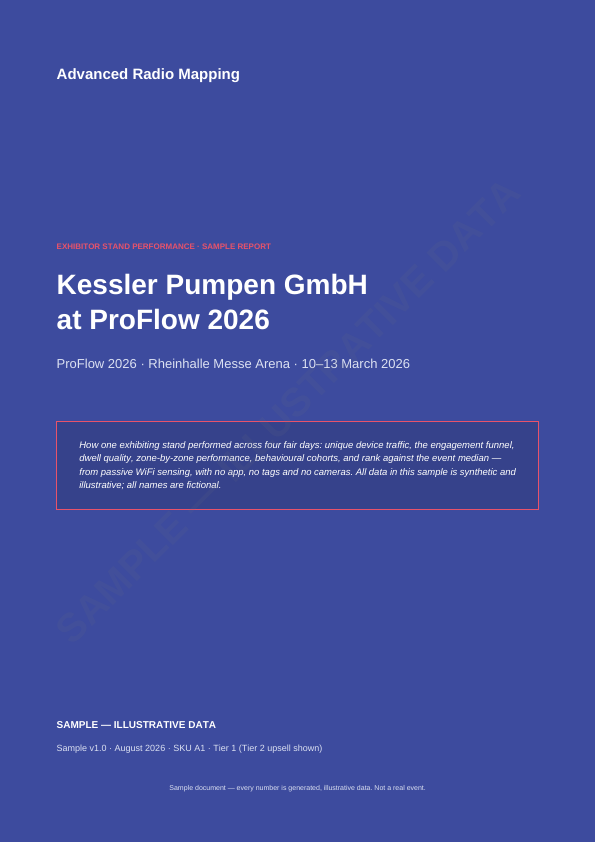 A1 · Exhibitor stand performanceDownload PDF
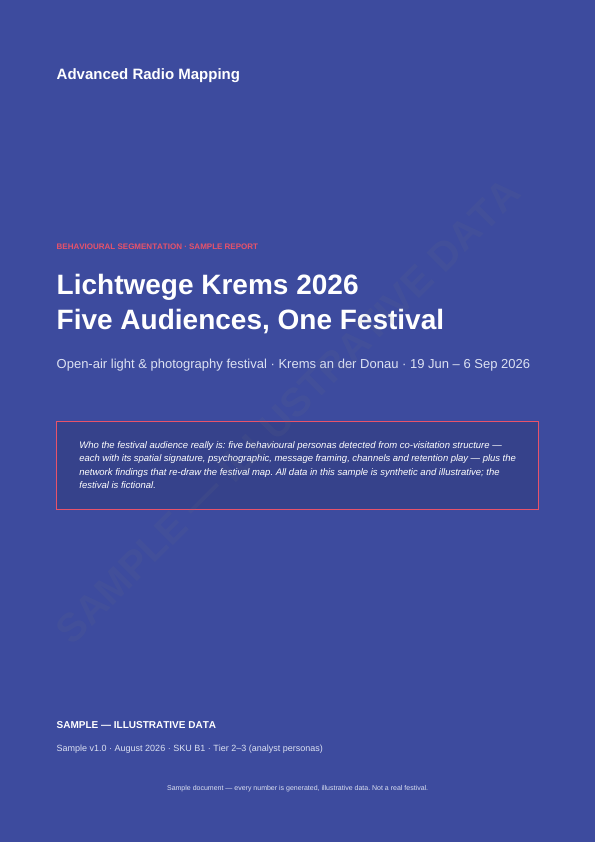 B1 · Behavioural segmentationDownload PDF
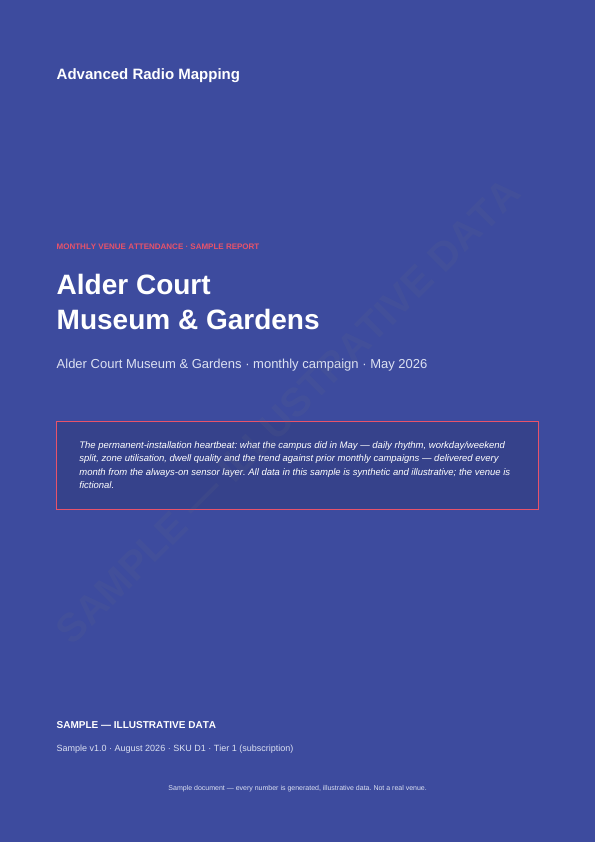 D1 · Monthly venue attendanceDownload PDF
The full catalogue — every SKU across the four families, with pricing — is a partner document. Ask for it.