Scope a deployment

Case studies

Named where we may, anonymised where we must.

Clients who have agreed to be named are named. The rest appear as anonymised proofs — the numbers are real either way, read from the production dashboard, and third-party names belong to their owners.

Named client

US Open (tennis) · PMY Group

Measured every US Open since 2021

A recurring tournament-scale deployment at Flushing Meadows, delivered with agency partner PMY Group. Over a ~23-day live window the 2025 edition ran two sensor clusters across the grounds, with daily figures in the dashboard through the tournament. Six consecutive editions — 2021 through 2026 — sit in the platform, which is the retention story: the deployment comes back every year because the numbers hold up. Continuity here means deployment continuity — each edition is measured on its own salt, never device recognition across years.

  • 220,621 unique devices at the 2025 edition
  • 36% engaged · 39% returning · 28 min average engaged dwell
  • Recurring since 2021 · delivered via PMY Group
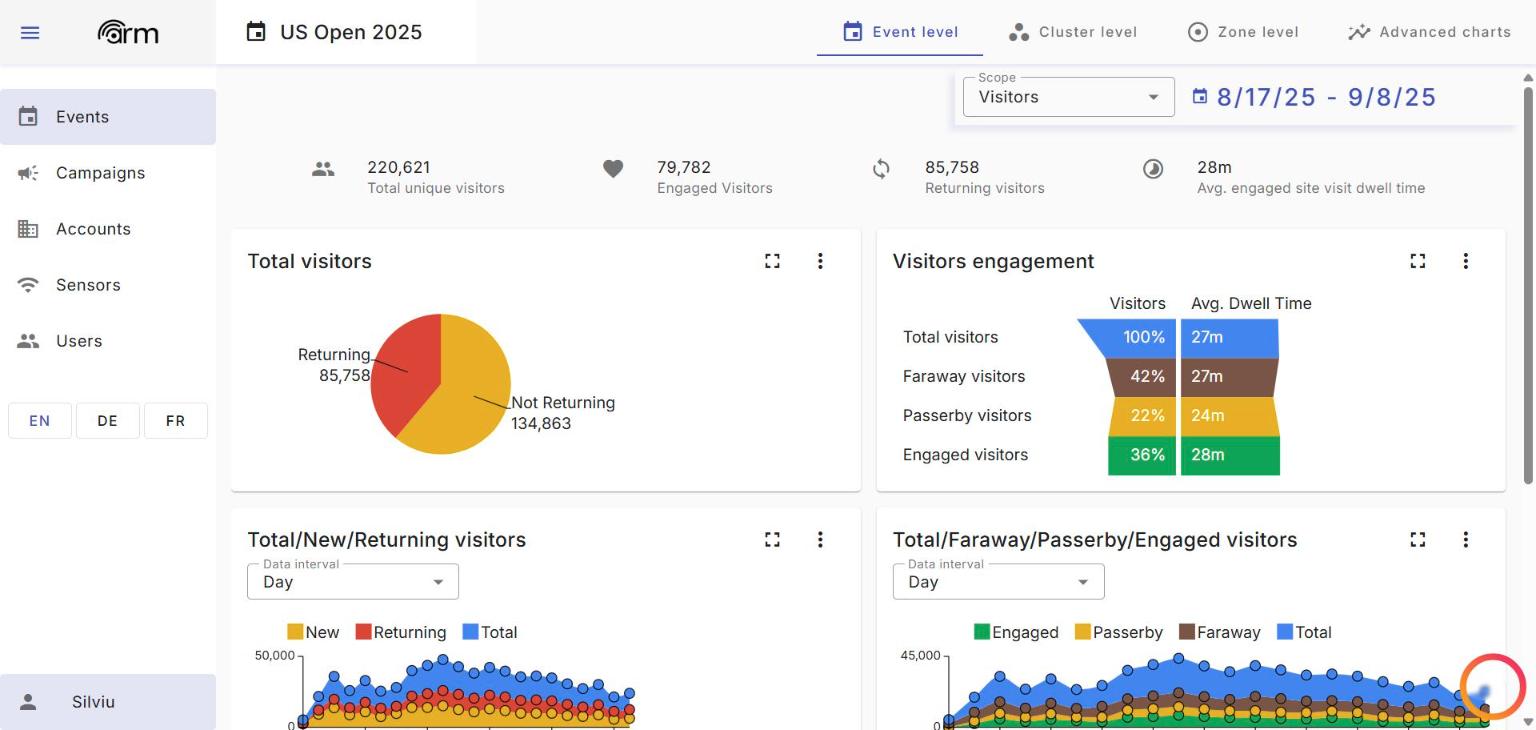
ARM dashboard: US Open 2025 event analytics — KPI strip, engagement funnel and daily series

Named client

Disney · Mirrored Media

One campaign, two activations, one comparable read

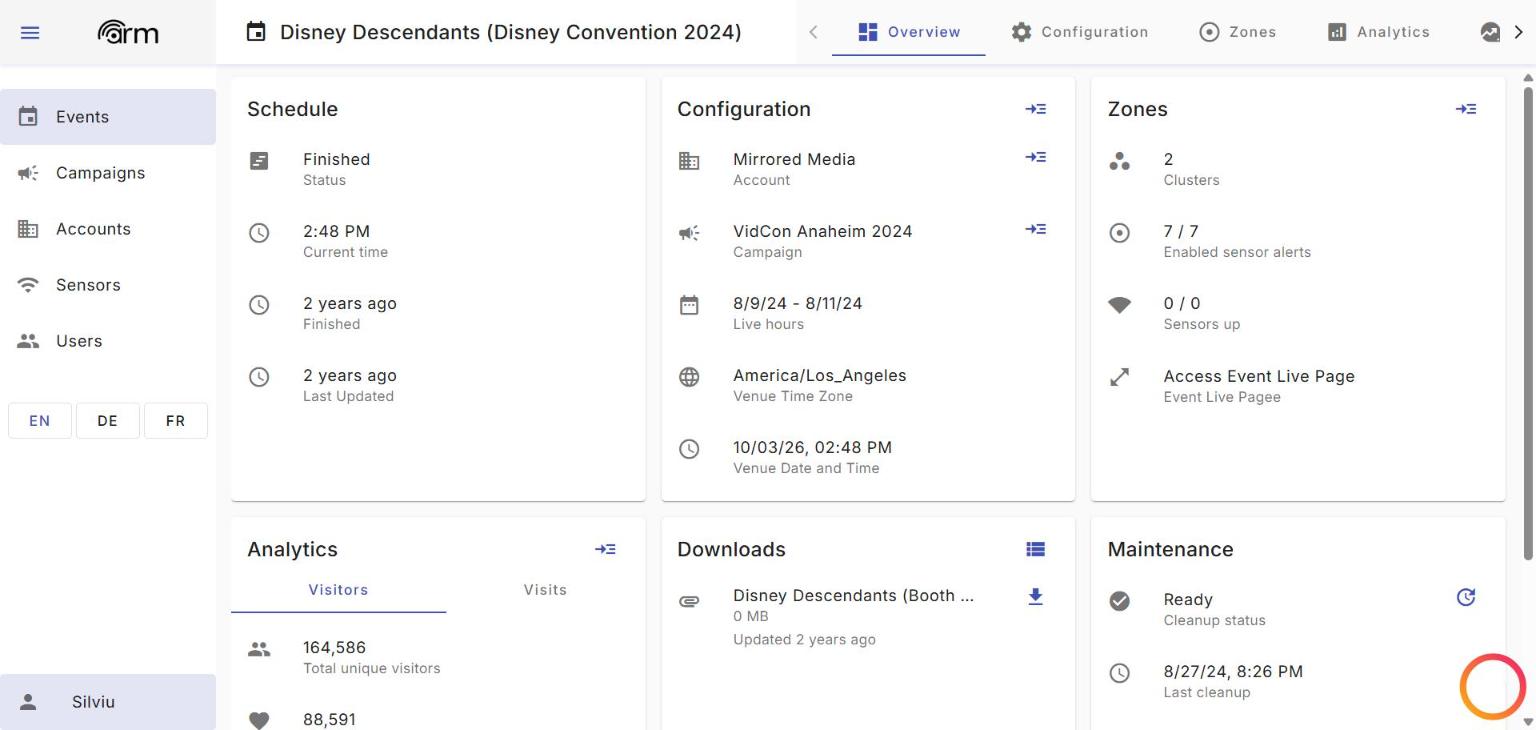
The Descendants campaign ran two activations in summer 2024: a convention presence in August and a booth at VidCon in June, both measured in the same campaign. The convention activation put just seven sensors against a crowd of over 160,000 unique devices — scale proof for a compact footprint — while the VidCon booth read 13,475 devices with 45 minutes of average engaged dwell. Because both sat in one campaign, the client compared activations on identical definitions rather than two vendors’ incompatible numbers.

  • Convention 2024: 164,586 unique devices · 54% engaged · 7 sensors
  • VidCon booth: 13,475 unique devices · 43% engaged · 45 min dwell
  • Cross-activation measurement in one campaign · via Mirrored Media
ARM dashboard: Disney convention activation 2024 overview

Named client · client-approved sample

Palfinger · Las Vegas

What a 22-sensor booth actually did

A two-floor, ~1,475 m² booth at a March 2026 trade show, instrumented with 22 sensors placed so every zone of interest sat inside a triangulation mesh. The report quantified the funnel from faraway to engaged, found the gravity centres on the stand, and put a number on the conversion gap between passers-by and engaged visitors — the lever for next year’s layout and staffing. Palfinger has approved this work for sharing, and the deployment pattern repeats at their European trade-fair programme.

  • 33,464 unique devices across five days
  • 9% engaged (3,084 devices) · 26% returning · 36 min engaged dwell
  • Full report available as a shared sample

Named client

TwitchCon · Las Vegas & Paris 2023

Convention-scale coverage with live capacity monitoring

Fifty-one sensors in seventeen clusters covered the Las Vegas show floor, with the attendance-monitoring module live for operations through show hours. The standout figure is dwell: 2 hours 20 minutes of average engaged dwell, the signature of a fan convention that holds its audience all day rather than cycling it. The Paris edition ran the same year on the same platform, giving the organiser a like-for-like read across two continents.

  • 21,409 unique devices · 51 sensors · 17 clusters (Las Vegas)
  • 2 h 20 min average engaged dwell
  • Capacity monitoring in production during show hours

Named client

TikTok Creators Lounge · VidCon 2024 · Mirrored Media

Measuring an activation inside a mega-convention

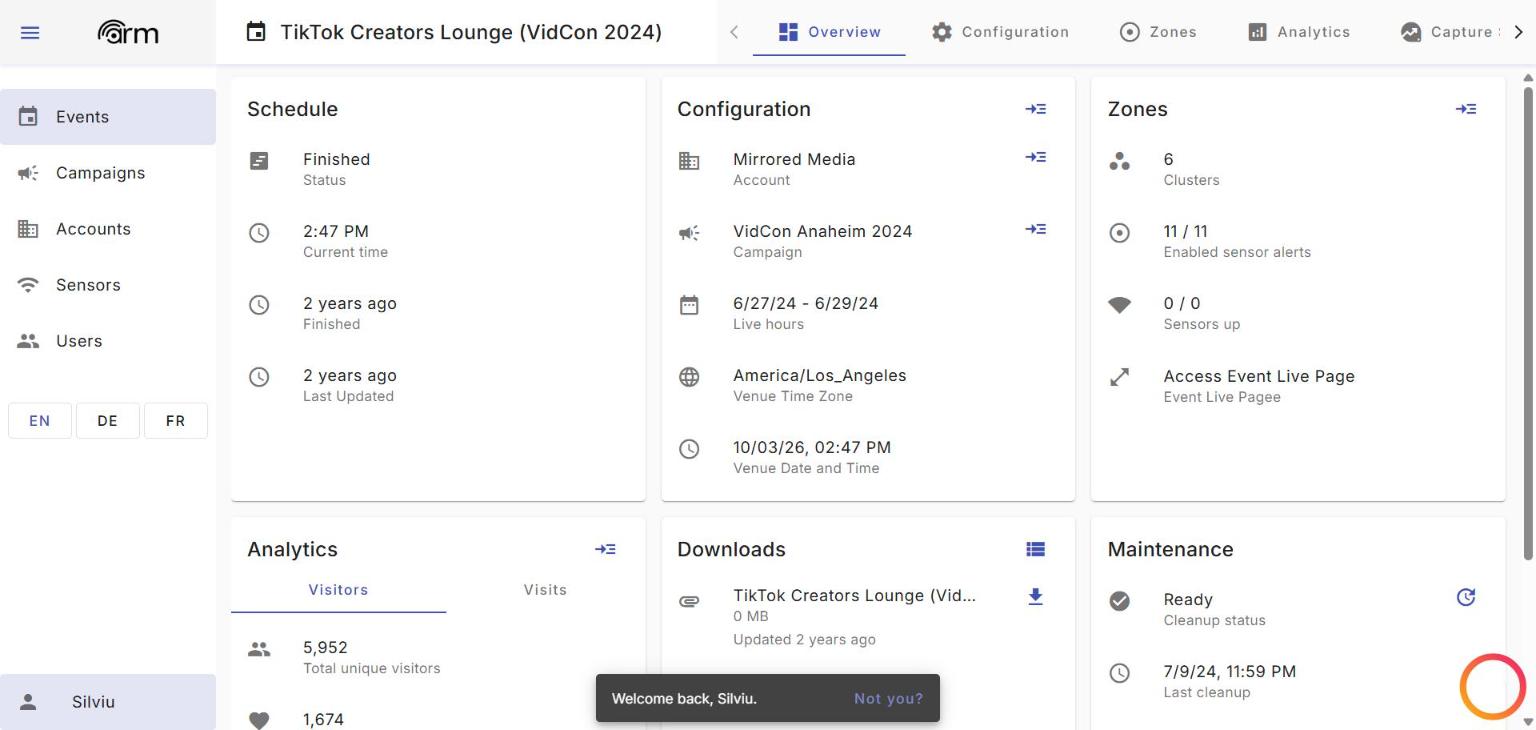
An eleven-sensor deployment measured a branded lounge inside VidCon Anaheim — the hard case, where the question is not how many people attended the convention but how many actually engaged with your activation. The lounge read 5,952 unique devices over three days with 28% engaged and 57 minutes of average engaged dwell: a clean separation of the activation’s own audience from the convention’s passing traffic, delivered through agency partner Mirrored Media.

  • 5,952 unique devices · 28% engaged · 24% returning
  • 57 min average engaged dwell · 11 sensors, 6 clusters
  • Agency delivery via Mirrored Media
ARM dashboard: TikTok Creators Lounge at VidCon 2024 overview

Named client

US Open of Surfing 2019 · World Surf League

The other US Open

A beach-side deployment at Huntington Beach for the 2019 US Open of Surfing, delivered for the World Surf League — open-air, free-access, and a different measurement problem from a ticketed venue: no gates, no fixed entrances, crowd building and draining with the tide and the heats. The passive sensor layer handled it the same way it handles a hall: zones, dwell, engagement, flow. It remains a useful proof that the platform reads open outdoor sites, not only exhibition floors.

  • Open-air, free-access beach venue
  • Delivered for the World Surf League
  • July–August 2019, Huntington Beach, California

Anonymised

A European motorsport event

Race-weekend crowd measurement at circuit scale

A recurring deployment at a major European motorsport event measures crowd build-up, grandstand-area dwell and cross-site movement across a race weekend. Circuit sites are the stress test for passive measurement: tens of thousands of devices, large open areas, and an operations team that needs same-day numbers rather than a report a month later. The deployment repeats, which is the quiet proof: the organiser keeps buying the numbers.

  • Recurring race-weekend deployment
  • Same-day daily reporting to the operations team
  • Client under confidentiality — shared as an anonymised proof

Anonymised

A major international Grand Prix

Checked against the box office: within 4%

At one international motor-racing Grand Prix, ARM’s weekend figure of 289,661 unique devices was compared with the event’s box office of 301,837 tickets — a difference of about 4%. Method note: these are different quantities that happened to land close. Device counts are not people counts — phones with WiFi off are missed, some visitors carry two devices, staff and fixtures are removed in daily cleaning — and ticket counts include no-shows. The comparison is a single-event calibration point at one venue type, not a general accuracy claim; agreement this close is venue- and event-dependent.

  • 289,661 unique devices vs 301,837 box-office tickets
  • Difference: about 4% at this event
  • Single-event calibration point, with the method note above

Your event could be the next row in the dashboard.

Scope a deployment